Growth in PAC financial activity slows
Financial activity by political action committees (PACs) continued its upward climb in 2007-2008, according to figures compiled by the FEC, though at a slower rate than in recent election cycles. From January 1, 2007, through December 31, 2008, PACs raised $1.2 billion, up 10.5 percent over 2005-2006, and spent $1.18 billion, up 11.8 percent over the previous two-year cycle. Comparable growth rates ranged from 18 percent to more than 30 percent during 2004 and 2006. Cash on hand as of December 31, 2008, for the 5,210 PACs totaled $308.6 million.
PAC contributions to federal candidates in 2007-2008 totaled $412.8 million, up 11 percent over 2005-2006. Most of the money—$385.9 million—was given to candidates seeking election in 2008. The remaining $27 million went to candidates running for office in future years, or to debt retirement for candidates in past cycles.
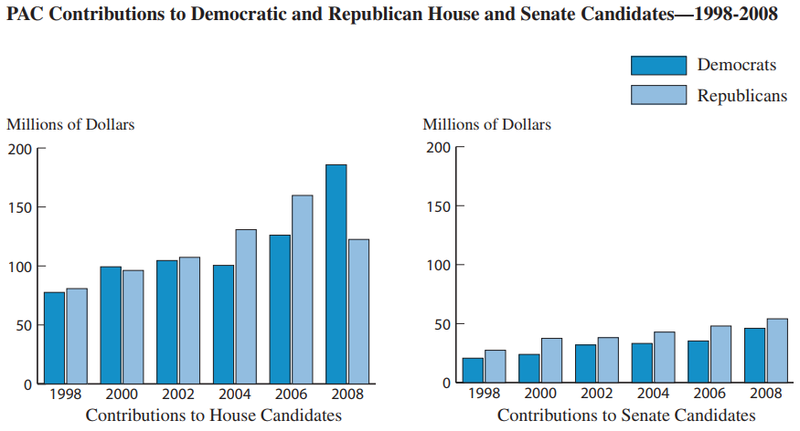
The charts below summarize PAC contributions to House and Senate candidates from 1998 through 2008, broken down by contributions to Democratic and Republican candidates.
Incumbents continued to receive most of the PAC contributions, as they have in previous elections. House candidates received $308.3 million from PACs, up 7.8 percent from the previous cycle, while Senate candidates received $100.1 million, up 16.3 percent over the 2005-2006 cycle. Republican Congressional candidates received $178.9 million, a decrease of 13.9 percent from the previous cycle, while Democrats received $233.9 million, an increase of 44.9 percent.
In addition to the $412.8 million in contributions, PACs made $135.2 million in independent expenditures for and against candidates, resulting in more than a 250 percent increase over the 2005-2006 cycle, and more than a 100 percent increase over 2003-2004, another Presidential election cycle. Of the $135.2 million, $85.3 million was spent on behalf of various candidates and $49.8 million was spent against them.
Some PACs (mostly nonconnected committees) also maintain nonfederal accounts and must therefore use a combination of federal and nonfederal funds to pay for activities that relate to both federal and state or local elections (e.g. overhead expenses, etc.). In addition to federal receipts and disbursements, PACs reported spending a total of $21,810,174 in nonfederal funds (sometimes called "soft" money) for these shared expenses in 2007-2008.
The full Commission press release on PAC activity is available at https://www.fec.gov/updates/growth-in-pac-financial-activity-slows/.
-
- Myles Martin

- Deputy Press Officer
- Myles Martin